Progress Bars
What is an Epic Sum Up Progress Bar?
A progress bar is a data visualisation of the status of any metric tracked in an issue.
Epic Sum Up progress bars make it easy for your team to sum up what is happening in issues at a glance.
Where can you find ESU Progress Bars?
Who are Epic Sum Up Progress Bars designed for?
Anyone who is involved in managing any sort of program, project or product, in Jira.
We've had positive feedback from project managers, program managers, and product managers who have found Epic Sum Up progress bars effective when managing timelines and budgets.
The most valuable part of Epic Sum Up for managers is the ability to see more than one performance metric in the Summary Panel. And to be able to quickly readjust values in the Detail View Editor that opens with a click on the progress bars.
Developers, UX designers, product marketers and other people within the project teams have also reported a positive impact from Epic Sum Up. People in project teams benefit from the simple displays of their progress.
Where did the idea for Progress Bars come from?
Our founder, Andreas Haaken is a gamer and a project manager. As a Jira user, he became frustrated with the inability to track the progress of issues inside epics - without clicking into every issue.
Andreas wanted to see how much time and budget had been spent at a glance.
Taking inspiration from the health bars in gaming, Andreas devised visual progress bars for Jira project management. He developed the tool with our team and Epic Sum Up was born.
How do the Progress Bars work?
Providing that a metric is tracked in an epic, you are able to configure a progress bar. Every time an issue event is updated, Epic Sum Up updates the progress bar value. We have built algorithms to calculate summaries, as fast as possible. As a result, you will have the most accurate and up to date information on progress bars.
Epic Sum Up progress bars can be used in the following structures:
Epics
Advanced Roadmaps
Types of Epic Sum Up Progress Bars
Time
Status category
Completed issues
Numerical
Story points
Custom
Calculated
Time Progress Bar
What is a time progress bar?
Time progress bars track Jira worklog values against issue time estimates. As a result, users can visualise the amount of time spent on any epic, at a glance - in the Summary Panel.
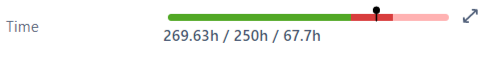
Interpreting time progress bars
Grey indicates the estimated time, not yet spent.
Green indicates the time spent within the estimation.
Red indicates time spent outside estimation.
Light red indicates the remaining time is over the estimated. Typically configured halfway through a project.
White indicates “won time” which indicates time saves from the project, which is ahead of schedule.
The numbers below the progress bar indicate the hours spent on time and budget, based on the configuration settings.
How to configure a time progress bar
No custom configuration is required on installation. You can customise the time progress bar to meet your project needs. Learn more here.
Test it yourself on our website
Status Category Progress Bar
What is a status category progress bar?
Visual of the number of tasks to do, in progress, and done in one bar based on issue count.
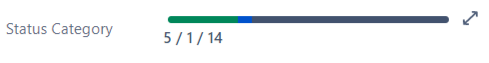
Interpreting status category progress bars
Dark Grey: The number of issues “to-do”
Blue: The number of issues in progress.
Green: The number of issues done.
The numbers below the progress bar indicate the issue count in the workflow statuses.
How to configure a status category progress bar
No custom configuration is required on installation. The status category progress bar does not automatically add to the Summary Panel. To add the progress bar to the Summary Panel navigate to “Summary Panel Settings” and select Status Category from the dropdown options.
On the standard configuration, both epics and subtasks will be recorded on the progress bar.
You can customise the Status Category progress bar to meet your project needs. Learn more here.
Completed Issues Progress Bar
What is a completed issues progress bar?
Visualise the number of issues resolved vs not resolved in a progress bar. Issues not resolved are a combination of all issues “in progress” and issues “to do”.
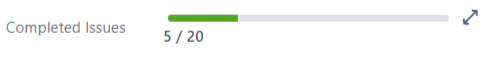
Interpreting completed issues progress bars
Green: The number of issues resolved.
Grey: The number of issues unresolved.
The numbers below the progress bar indicate the number of issues resolved/total number of issues.
How to configure a completed issues progress bar
No custom configuration is required on installation. The completed issues progress bar is automatically added to the Summary Panel. On the standard configuration, both epics and subtasks will be recorded on the progress bar.
Please note - Jira settings directly impact completed issues progress bar.
As a result, the Jira setting MUST be correctly configured to ensure accurate reporting. If your completed issue progress bar does not represent the current status of issues, please check your Jira configuration. Learn more about this configuration here.
You can customise the completed issues progress bar to meet your project needs.
Learn more about customisation here.
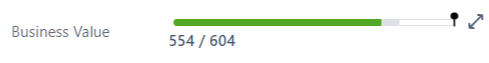
Story Points Progress Bar
What is a story points progress bar?
Visualise the issues resolved vs issues unresolved, weighted by story points. The greater the number of story points, the greater the visual representation on the progress bar.
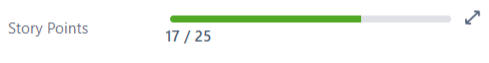
Interpreting story point progress bars:
Green: The number of issues resolved, weighted by story points.
Grey: The number of issues unresolved, weighted by story points.
The numbers below the progress bar indicate the number of story points of the issues resolved/total number of story points.
How to configure a story points progress bar
No custom configuration is required on installation. The story point progress bar does not automatically add to the Summary Panel. To add the progress bar to the Summary Panel navigate to “Summary Panel Settings” and select story points from the dropdown options.
On the standard configuration, both epics and subtasks will be recorded on the progress bar. You can customise the story point progress bar to meet your project needs.
Learn more about customisation here.
Custom Numerical Progress Bars
What is a custom numerical progress bar?
Custom numerical progress bars, allow users to create custom progress bars based on any number based field.
Interpreting custom numerical progress bars
Similar to story point progress bars, issues get weight by the value.
Green marks resolved.
Grey marks not resolved.
How to configure a custom numerical progress bar
Create your own custom numerical progress bar based on any number field supported by Epic Sum Up. Epic Sum Up supports all Jira custom fields plus fields from other tools such as Jira Workflow Toolbox (JWT). In future releases we plan to support other fields by Script Runner and more.
While the metrics to track are basically endless, here are a few examples:
In combination with Scriptrunner and Jira Workflow Toolbox
Numerical Custom field
If you would like to request a field to be added to the next version of Epic Sum Up please contact our team here.
Learn more about customising these progress bars here.
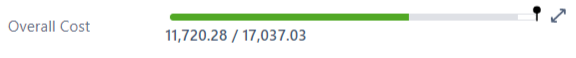
Calculated Progress Bars
What is a calculated progress bar?
Calculated progress bars allow users to make progress bars based on simple calculations. In contrast, to other calculation tools, Epic Sum Up calculated progress bars do not require knowledge of Jira expression.
Interpreting calculated progress bars
Similar to custom numerical progress bars, issues get weight by the value.
Green marks resolved.
Grey marks not resolved.
How to configure a calculated progress bar
Simply select two values with an operator to perform the calculation required for the progress bar.
Epic Sum Up supports all Jira custom fields, fields from other tools such as Jira Workflow Toolbox (JWT) and custom values. In future releases we plan to support other fields by Script Runner and more as well.
While the combinations are basically endless here are a few examples:
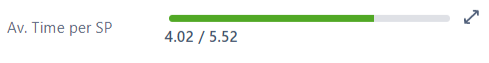
Story points / time = Av. time spent per story point
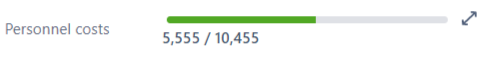
Custom value ($100) x time spent = Personnel cost.
Learn more about the configuration here.
Budgets for Progress Bars
You can add a budget marker to the following progress bars:
Time
Numerical
Story points
Custom
Calculated
If the value goes over budget the progress bars turns red or light red, depending on the estimation or resolved state of the issue.
A detailed guide on how to add a budget marker to progress bars can be found here.
Progress Bar Configuration
Learn more about how to configure what is in your Summary Panel, here.