How to add the Epic Sum Up Dashboard Gadget to Confluence Cloud
The Epic Sum Up Grid Gadget is not supported in Confluence due to its complex technical features. However, there is a workaround on how to display it in Confluence. Follow this step-by-step guide:
Create a completely new dashboard
Add the Epic Sum Up Filter Results Grid Gadget to the dashboard
It’s important that it is the only gadget on the dashboard
Also make sure that your layout only has one frame
Configure the gadget to your needs and save it
In the top right corner of the dashboard, open the "..." Menu, select "View as wallboard" and copy the URL
It should look something like https://yourcloud.atlassian.net/jira/dashboards/wallboard?dashboardId=10001
Open the Confluence page where you want to display the Epic Sum Up Filter Results Grid Gadget and go into edit mode
Click on "+", click "View more"

Search for "Iframe," select it, and click "Insert" (bottom right corner)
In the URL field, enter the wallboard URL copied previously and adjust remaining settings (width and height) of the Iframe
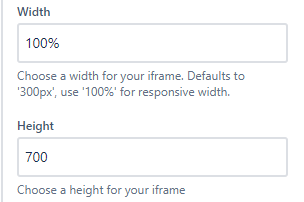
Just an example
Save/Update
You should now see gadget on your Confluence page.
Please keep in mind that some functionality working in Jira might not work as expected in Confluence(e.g. Opening the Detail View Editor doesn't work).
If you run into any issues, please contact our support team at esu@aptis.support.